Brainwaves Jam
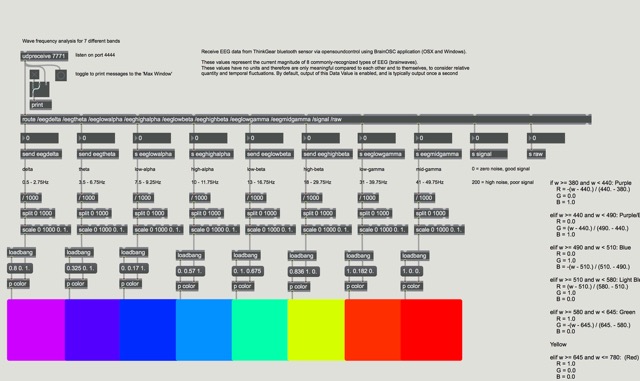
I wanted to visualize the brain wave data in some way so that I could explore the relationship of brainwaves to action in a way that was more accessible to observers and myself. To visualize the data, I mapped the brainwave frequencies to the visible light spectrum and connected a color panel to each brainwave in the Max MSP patch. The more present that brainwave was the more intense the color associated with it was. I noticed I was seeing a large amount of delta waves active in the data stream. This didn’t make a lot of sense as the delta waves are mostly associated with deep sleep. I figured out that the global EEG range field in the BrainWave OSC app needed to be turned on in order to get a more evenly distributed reading.
The other frustrating element of the app was that the data values for each brainwave were incredibly different and I was unable to find the max and min of the data points. I ended up having to guess on what numbers to use for scaling the data into a usable format for my needs. This made the color mapping more crude then I would have liked.
Once I had finished building and mapping the colors to the brainwaves I put on the brainwave scanner and began to play piano. I felt the color representation was an interesting way to have a ‘glimpse’ into the way my brainwaves were responding as I was ‘resonating’ with the music I was playing. I began to think of ways to incorporate this visualization into my performance.